Comic Grader: grading comic books from photographs with a detector, several VLMs and a lot of evaluation
Comic grades on the 0.5–10.0 scale can move a full point because of a corner tick a few millimetres wide. Comic Grader requires five photos of a single comic, each a different view: front and back flat, front and back at an angle, and the centerfold.
Case study · October 2026
A production system that finds physical defects on comic covers from phone photos and turns them into grading evidence. This is an account of how it was built, measured, broken and rebuilt, including the parts that didn't work.
Robert Miller · Founder, LongBox Technologies · Python · PyTorch · RF-DETR · DINOv3 · FastAPI · Postgres · Docker
Summary
The short version
Comic grades on the 0.5–10.0 scale can move a full point because of a corner tick a few millimetres wide. Comic Grader requires five photos of a single comic, each a different view: front and back flat, front and back at an angle, and the centerfold. It proposes candidate defects with an object detector, describes and judges each candidate with vision-language models, and hands a person the uncertain ones.
Most of the engineering went into measurement. Twice the most useful discovery was that the thing I was optimizing was not the bottleneck. In August only 26% of real defects ever became proposals, so no judge could fix grading. In September I found the training labels themselves could not be trusted. That led to rebuilding the whole labelled corpus: 4,330 books, 138,575 regions checked by a describer → verifier → judge chain for about $655 in API usage, then human review.
A blind-labelled benchmark of 146 covers, which I labelled by hand, showed what the rebuild was worth. Retraining on the model chain's labels barely moved overall accuracy, because a model trained on a judge's labels learns to agree with the judge. It did move recall on the hardest defect types, and tiling the photo recovered some of the missed tears (recall 65% to 80%). So I started relabelling every cover by hand. A first trial on just 192 audited covers already beat models trained on about 3,700 covers of chain labels for tears and corner wear.
At about 900 audited covers, models trained on my labels beat production on the benchmark for corner wear (AP50 0.33 → 0.63). The fresh-trained spine and crease models also beat it (0.21 → 0.44 and 0.30 → 0.46), but those are single runs with no interval against production. They then had to pass a replay through the whole production pipeline at production's own region volume, and on 25 October those three became the first models trained on my labels to grade books in production. The first three books cost $0.97 to $2.18 each in API usage, against $12.61 for one September test book graded before the region cuts.
- 4,330 physical books after deduplicating the image corpus
- 138,575 candidate regions audited by the model chain
- 14 defect types, from corner wear to detached covers
- 1,405 defects I labelled blind on 146 covers, the development benchmark
- 909 covers I had audited by hand when the third retrain was cut
The problem
Small, ambiguous defects on printed art
A grader looks for 14 kinds of damage (the v1 taxonomy): corner wear, spine stress, tears, creases, missing pieces, staple problems, writing, surface wear, foxing, stains, water damage, colour fading, tape and detached covers. Many are tiny compared with the cover. Many have lookalikes printed into the art: drawn cracks, deliberate "distressed" covers, glare, the table under the book.
Requirements the design had to meet:
- High recall on small defects. A defect that is never proposed can't be graded.
- Few invented defects. Every false one lowers the grade.
- Evidence for each defect (a box, a description, a verdict) so a grade can be explained and audited.
- Ordinary phone photos, not a scanning rig.
- A cost per book people will pay, with slow or expensive model calls kept off the critical path.
The system
Each stage exists because of a measured failure
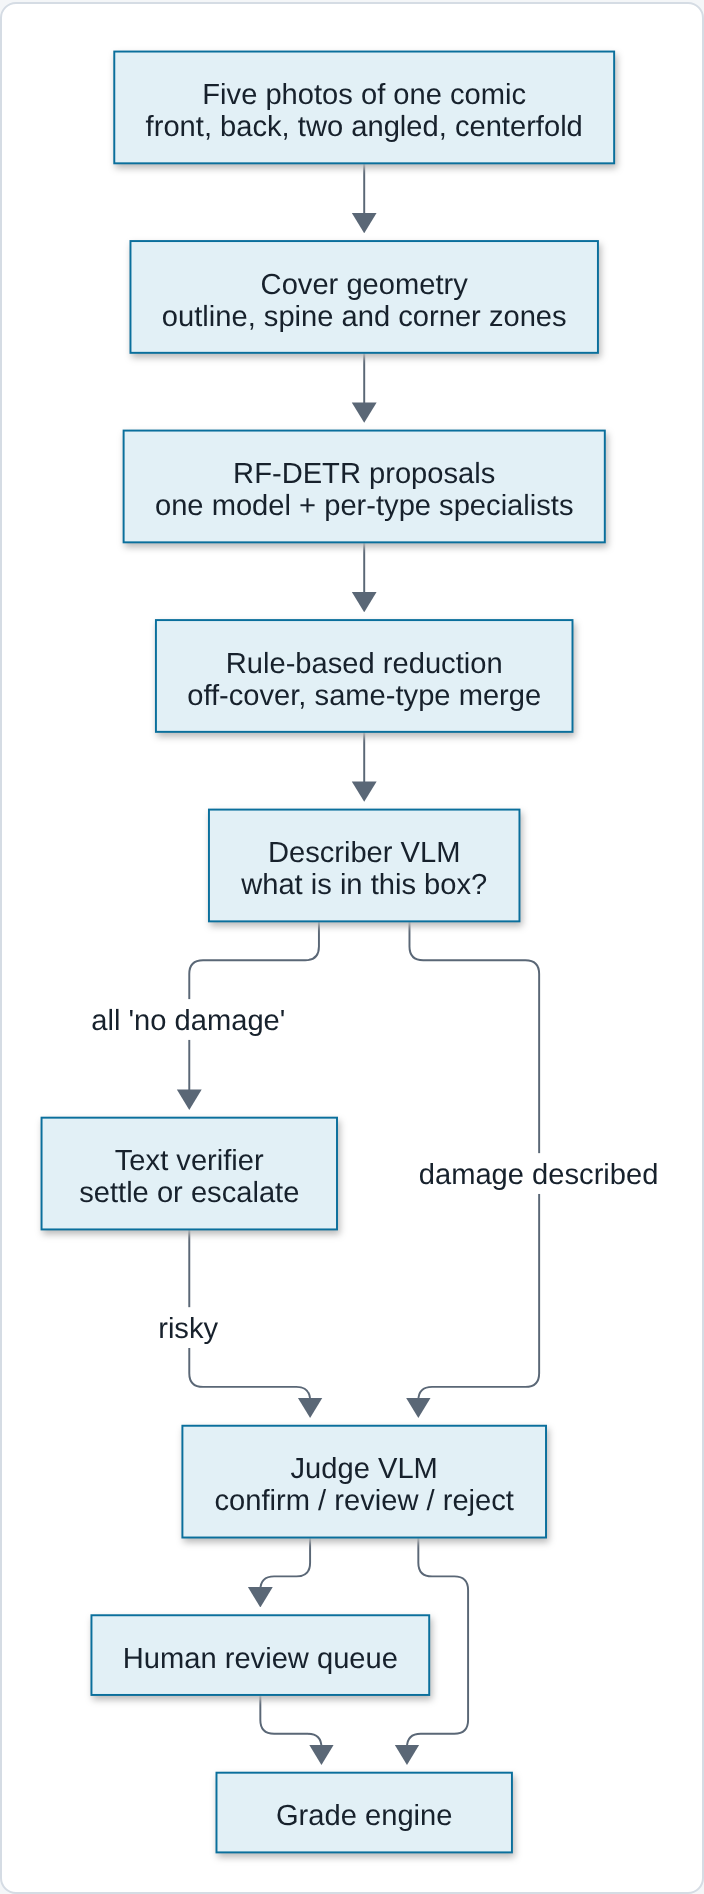
Proposals. RF-DETR (a transformer detector) runs recall-first: false positives are acceptable here because later stages clear them, while a miss is permanent. A general model covers all 14 types and specialists cover the types where the general model was weak.
Reduction. Cheap geometry rules remove boxes that are off the cover or duplicate another box of the same type. Boxes of different types are never merged. A corner can be both worn and torn, and merging across types lost real defects.
Describer. A VLM answers narrow yes/no feature questions about each region instead of giving a verdict. On an owner-labelled test book, the chosen describer found 27 of 31 real defects with 3 false alarms; the previous model found 4.
Text verifier. When the describer sees no damage, a text-only verifier scores a few atomic risk questions about its description, and code decides whether the region can be settled without a judge call. On the corpus run this settled 51,158 regions.
Judge. A second VLM sees the region, the wider context and the describer's notes, and confirms, rejects or sends it to review. Rare, high-impact types always go to review.
Human review. Uncertain regions go to a person. Their decisions are written back as labels, so review improves the next training run.
Evaluation
How I try not to fool myself
- Human labels are the only ground truth. Model verdicts are never scored against other model verdicts. Test sets are labelled blind, with no model boxes shown.
- Split by physical book, sealed where it counts. Test data is split by physical book, so no book appears in both training and test. A sealed set is opened once, and once it has influenced a decision it is treated as exposed. The older sealed sets, the gold detection test split and two grading cohorts, are still sealed. The 146-cover blind benchmark below is not: it has informed several decisions, so I treat it as a development benchmark, and promoting a model needs a fresh set of real phone photos.
- Decision rules written before the run. Each experiment states in advance what result promotes a model, so an inconvenient number can't be explained away afterwards.
- Per-type metrics. One average hides a model that is excellent at corners and useless at stains, so results are reported by defect type.
- Cost and latency alongside accuracy. Each model run records cost per region and median and 90th-percentile seconds per call. A model that is accurate but slow on the critical path loses.
- Leaks checked by hash. Every test image is hashed against every training set. 85 of the 150 covers I labelled blind turned out to be byte-identical to images an older production model had trained on, 82 of them among the 146 that were scored. Results are also reported on the 64 scored covers with no byte-identical copy in training. That check only catches exact copies; a re-scan or a second copy of the same book can still slip through.
What went wrong
Three investigations that changed the plan
August 2026
The judge wasn't the bottleneck; proposals were
I spent weeks comparing judge models. Of 247 human-labelled real defects in a sealed test slice, only 65 (26.3%) ever reached the judge as proposals. I broke 182 misses down by cause: 93 were proposed as the wrong defect type, 43 were boxed in the wrong place, 30 were never proposed and 16 were lost during merging.
Decision: freeze judge work and move effort upstream to proposals. It also explained why the grade engine failed: both candidate engines were grading books with three-quarters of their defects missing.
Negative result
Fine-tuning a 32B VLM made it confirm everything
A QLoRA fine-tune of Qwen3-VL-32B for water damage trained cleanly and then failed promotion. Specificity fell from 95.5% to 9.6% and false positives rose from 4 to 75. The cause was the training targets: every "confirm" example carried the same boilerplate explanation, so the model could learn the verdict without looking at the image.
Decision: after three valid negative fine-tuning runs, conclude that the limit was the evidence in the training data, not model capacity. Separately, a trained classifier for choosing the defect type failed its own gates twice (47% top-1 against a 75% bar), and I closed that approach instead of tuning it on the test data.
September 2026
The training labels couldn't be trusted
Labels had come from many tools and review passes over two years. When I checked, three problems turned up:
- On 125 pairs of the same scan labelled in different passes, only about 20–30% of "gold" boxes matched each other.
- 956 of 3,211 images in the gold detection set turned out to be synthetic augmentation output renamed like real photos, including images in the test split.
- Some label sets used coordinates relative to a crop, so their boxes sat in the wrong place on the full image.
Decision: stop training on the old labels and rebuild the corpus (next section).
October 2026
Separating "can't learn" from "never taught"
85 of the 150 covers I labelled blind turned out to be in an older model's training data. Instead of only discarding them, I used them as a test: a model should reproduce the boxes it was trained on. Where it can't, the limit is the model; where it can but disagrees with my labels, the limit is the labels.
- The old labels found only 15 of my 122 corner-wear boxes and 15 of my 101 tears on those covers, and 63 old spine boxes overlapped none of my 10: incomplete labels and a different convention.
- The production tear model found only 70% of tears it had been trained on, while the corner model found 100% of its own. Tears are thin and the detector sees a downscaled photo, which pointed to tiling (results below).
Decision: clean every label by hand before any further model change, and retrain at checkpoints (about 450 audited covers first, then about 1,000 and 2,000, then all) to see whether human labels move the blind numbers.
Negative result · October 2026
Box size was a convention, and it mattered
After the second retrain I tightened every corner box in the audit, expecting cleaner labels to help. The retrain on them got worse: its boxes came out at about half the area of my benchmark boxes, and corner AP50 fell to 0.29–0.39. My blind benchmark boxes sit at a natural size, about 0.076 × 0.053 of the image. Growing the same tight boxes back to that size in code, anchored at the outer corner, brought AP50 back to 0.45–0.54 with no new labelling.
Spine had the same problem the other way round: three-quarters of my training spine boxes were small ticks, while the benchmark mostly marks a damaged spine as one long run.
Decision: one written box-size standard per type, applied at export time as a derived step that the export receipt records and that is never described as human labels. Corner boxes are regrown to benchmark size, so every cover's median corner box lands in the standard band; spine ticks less than 3% of the cover height apart are joined into one run.
Rebuilding the data
Relabelling 4,330 books without hand-labelling 200,000 boxes
I deduplicated images by physical book, since the same scan often appeared under several names. I kept all 131,803 existing boxes but treated none as trusted, and added fresh RF-DETR proposals everywhere. Before any rule was applied, I spot-checked 310 new-only proposals by hand, sampled by confidence band. That check showed production's old confidence cut-offs would have thrown away real defects: 30 of 37 spine boxes below the old cut-off were real. Most of those, though, duplicated a stronger box of the same type, so a same-type merge replaced the cut-offs.
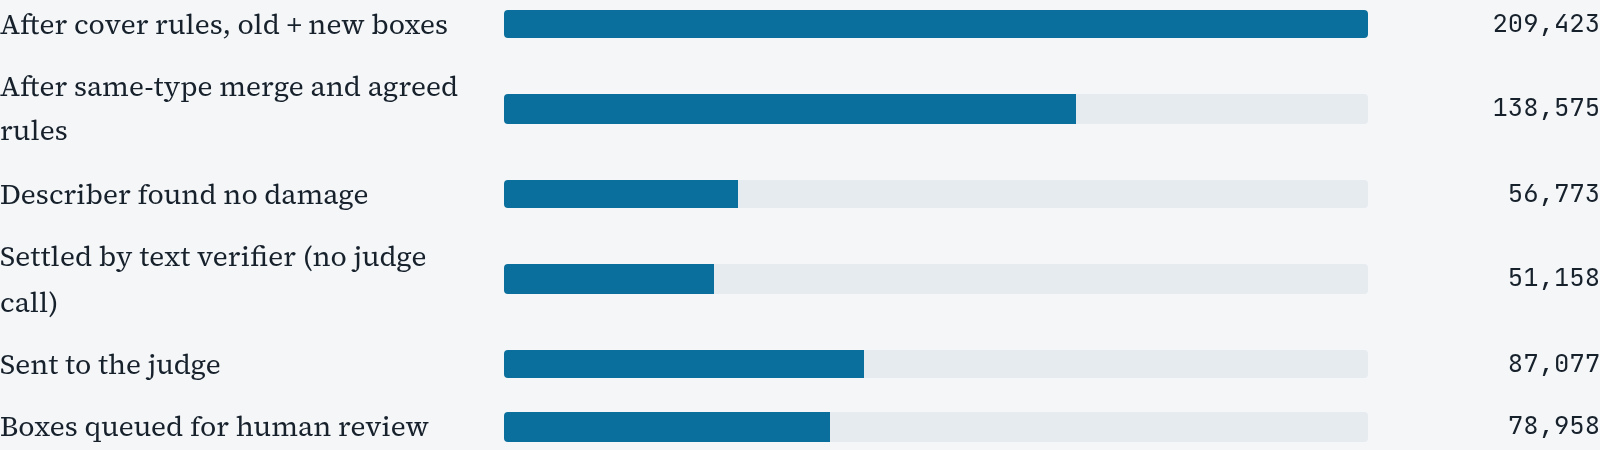
Bars share one scale (209,423 = full width). About 1.37 million raw detector boxes were removed by the cover rules before the first bar.
The run was unattended and resumable, on a single 16 GB GPU shared with production. The first attempt was killed for running out of memory: the runners cached every cover image. I fixed the caching, made crashes exit non-zero so the container restarted, and resumed where it stopped. On 308 regions I labelled myself, the chain kept 155 of 183 real defects and correctly rejected 101 of 125 non-defects. The 28 real defects it lost were mostly appearance damage such as stains and fading.
Human review happens in Label Studio, one pass per cover, with every box editable. Separately, I labelled 150 covers blind, with no model boxes shown, as a development benchmark (next section).
API usage for the whole run was $655, just under half a cent per audited region.
Results
The blind-labelled benchmark: 146 covers
I labelled 150 covers by hand with no model boxes shown. Two lot photos and two non-comic images were excluded, leaving 1,405 defects on 146 covers, and every model was scored against them. This is a blind-labelled development benchmark, not a sealed test: 82 of the 146 covers had images in production's training data, so I also report the 64 with no byte-identical copy in training.
| Detector | mAP50, all 146 | mAP50, 64 with no exact copy in training |
|---|---|---|
| Production (per-type Medium models + one 14-type model) | 0.235 | 0.259 |
| Retrained on the relabelled corpus, one model | 0.265 | 0.291 |
| Retrained, one Large model per type | 0.257 | 0.287 |
The validation gain was mostly an echo. On validation covers labelled by the model chain, the retrain looked like a large improvement (corner wear 0.13 → 0.39). On blind human labels the overall gain is about 0.03. The training labels came from the judge, and the judge's confirms match my boxes only about 40% of the time, so the new models learned to agree with the judge. The labels were the ceiling, not the detector.
Where it did help: recall on the hard types. Share of my 1,405 boxes that get an overlapping proposal (IoU ≥ 0.5):
| Defect type | My boxes | Production | New per-type models |
|---|---|---|---|
| Stain | 47 | 0.00 | 0.60 |
| Water damage | 26 | 0.08 | 0.54 |
| Foxing | 42 | 0.00 | 0.45 |
| Surface wear | 79 | 0.00 | 0.46 |
| Tape | 7 | 0.14 | 0.86 |
| Spine | 53 | 0.81 | 0.89 |
| Tear / chip | 479 | 0.73 | 0.60 |
| Crease / bend | 80 | 0.88 | 0.78 |
Recall here counts a box as found if any proposal overlaps it, however many proposals a model makes. That is weak evidence for corner wear and spine: at 100 boxes per cover, random boxes placed where my labels usually sit reach about 0.98 recall on corner wear and 0.91 on spine without looking at the image, so the spine figures above sit below that chance level. The chance baseline and a fairer top-10 comparison follow below.
Production never proposes stain, foxing or surface wear at all, so any proposals there are new coverage. Tear and crease got worse, so production's models stay for those types.
Tiling fixes tears. Running production's tear model over a 2×2 grid of overlapping tiles from the full-resolution photo, as well as the whole image, raised tear recall from 65% to 80% (82% on the 64 covers with no exact copy in training). Both figures are counted after merging overlapping boxes; production as served, without that merge, finds 73%. Precision did not change; the extra proposals are sorted out downstream.
Coverage of the whole pipeline. With production's proposals alone, 72% of my boxes get a candidate region at all. Combining production's and the new models' proposals and keeping detector scores ≥ 0.02 raises that to 80%, at about the same region count per cover (141 vs 131). The September chain run found 55% of my boxes end to end. It kept 92% of the defects it could reach, so most of the loss happens before any model reads anything.
First retrain on human labels: 192 covers
Before the full audit finishes, I ran a small trial to test the whole path from my labels to a scored model, and to get an early answer on whether human labels help. Covers are split by artwork group, so the same artwork or physical book never lands in both training and validation. The roles are frozen, so no cover changes side at later checkpoints. The export refuses anything excluded, held out or model-labelled, and records a hash receipt that training checks. I trained tear, corner and spine models on the 192 audited training covers: once fine-tuned from the chain-trained models, once from the standard pretrained start. Then I scored them on the same 146 blind covers.
| Defect type (my boxes) | Chance, no image | Production | Chain labels, ~3,700 covers | My labels, fine-tuned | My labels, fresh |
|---|---|---|---|---|---|
| Tear / chip (479) | 0.001 / 0.19 | 0.083 / 0.73 | 0.108 / 0.60 | 0.155 / 0.69 | 0.132 / 0.66 |
| Corner wear (474) | 0.205 / 0.98 | 0.327 / 0.98 | 0.317 / 0.99 | 0.486 / 0.97 | 0.513 / 1.00 |
| Spine (53) | 0.031 / 0.91 | 0.211 / 0.81 | 0.085 / 0.89 | 0.163 / 0.98 | 0.299 / 0.81 |
Each cell is AP50 / recall at IoU 0.5. The chance column uses boxes drawn from where my labels usually sit, with random scores and no look at the image; its recall is at 100 boxes per cover. Differences were checked with a paired bootstrap over covers (500 resamples); the 64 covers with no exact copy in training move the same way.
- Tear: 192 human-labelled covers beat about 3,700 chain-labelled ones. AP rose by 0.046 (95% interval +0.015 to +0.074) and recall by 0.09 (+0.05 to +0.13). Production's served tear model still finds slightly more (0.73), so tiling stays the recall lever.
- Corner wear: AP rose by 0.17 to 0.20 over both the chain-trained model and production. The gain is precision: far fewer duplicate and false corner boxes, the same duplicates I had been deleting by hand.
- Spine: with 53 test boxes, the AP comparison is inconclusive.
A chance baseline caught a flattering metric. A reviewer asked for a chance row, and it mattered. Boxes drawn at random from where my labels usually sit, with random scores and no look at the image, reach 98% recall on corner wear and 91% on spine at 100 boxes per cover. Corners and spines are always in the same places. So the near-perfect recall figures above say nothing for those types. AP and recall with a small budget of top-scoring boxes do: with 10 boxes per cover, corner recall is 0.65 at chance, 0.75 for production and 0.90–0.96 for the models trained on my labels; spine is 0.53, 0.66 and 0.77–0.79. The human-label gain survives on both measures for corner wear and shows on top-10 recall for spine, where the AP comparison is inconclusive. Every scoring run now reports the chance row.
Recall at IoU 0.5 with only the 10 top-scoring boxes per cover, 146 covers:
| Defect type | Chance, no image | Production | Chain labels | My labels, fine-tuned | My labels, fresh |
|---|---|---|---|---|---|
| Tear / chip | 0.02 | 0.27 | 0.29 | 0.36 | 0.33 |
| Corner wear | 0.65 | 0.75 | 0.82 | 0.90 | 0.96 |
| Spine | 0.53 | 0.66 | 0.62 | 0.79 | 0.77 |
Two caveats. I drew both the training labels and the test labels, so part of the gain is the models learning my box conventions, which is the target. The 146 covers have also been used for several decisions now, so they serve as a development benchmark; promotion needs a fresh set of real phone photos. Nothing was deployed. The point of the trial was the answer to "do human labels help at all", and for tear and corner wear they do; spine is inconclusive.
Why absolute numbers are low. Stain, foxing, surface wear, fading and water damage are differences from how the cover should look, so a box around them is poorly defined, and old labels and my labels drew them differently. In an earlier bake-off the same detector reached 0.75 AP50 on writing but 0.02 on stain. External clean-reference downloads are off by default for now, so the next steps for these types work without an outside reference: checking regions at native resolution, and checking that areas printed as one flat colour are uniform.
What comes next
Tracking the gain as the audit grows
The 192-cover trial was the first checkpoint, not the last. I retrain at fixed points as the audit grows. The second checkpoint, at about 450 audited covers, trained on 414 covers with 51 held for validation. The third, planned at about 1,000, was cut on 24 October at 909 audited covers, 817 for training and 88 for validation, with the box-size steps above. Next come about 2,000 audited covers, then every eligible cover.
Every checkpoint uses the same frozen split, so no cover changes side, and is scored on the same 146-cover benchmark with the chance row and top-5, 10 and 20 recall alongside. That makes each checkpoint a comparable point on the same chart.
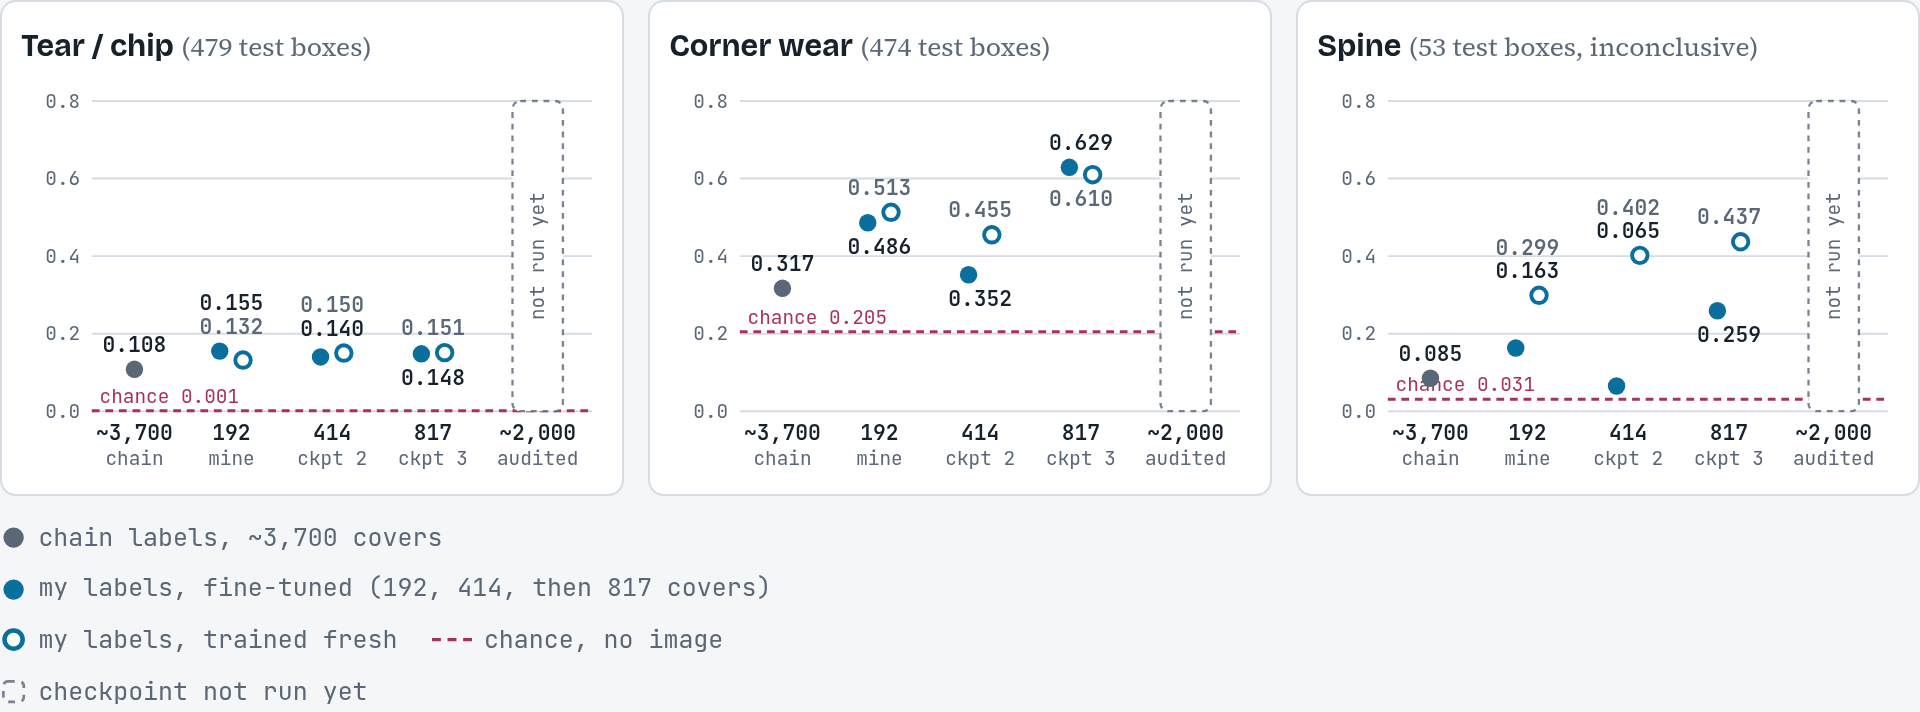
Chart data as a table
| AP50, 146 covers | Tear / chip | Corner wear | Spine |
|---|---|---|---|
| Chance, no image | 0.001 | 0.205 | 0.031 |
| Chain labels, ~3,700 covers | 0.108 | 0.317 | 0.085 |
| My labels, 192 covers, fine-tuned | 0.155 | 0.486 | 0.163 |
| My labels, 192 covers, trained fresh | 0.132 | 0.513 | 0.299 |
| Retrain 2, my labels, 414 covers, fine-tuned | 0.140 | 0.352 | 0.065 |
| Retrain 2, my labels, 414 covers, trained fresh | 0.150 | 0.455 | 0.402 |
| Checkpoint 3, my labels, 817 covers, fine-tuned | 0.148 | 0.629 | 0.259 |
| Checkpoint 3, my labels, 817 covers, trained fresh | 0.151 | 0.610 | 0.437 |
| ~2,000 audited covers | not run yet | ||
Retrain 2 did not continue the gain. More than doubling the training covers, from 192 to 414, left tear flat (AP50 0.140 fine-tuned and 0.150 fresh, against 0.155 and 0.132) and made corner wear worse: fine-tuned fell from 0.486 to 0.352 and fresh from 0.513 to 0.455, and both drops have bootstrap intervals that exclude zero. Spine trained fresh rose from 0.299 to 0.402, but that interval includes zero and spine has 53 test boxes; spine fine-tuned fell from 0.163 to 0.065. I have not tested why corner dropped. Retrain 2 still beats the chain-labelled models on tear, and on corner and spine trained fresh (bootstrap intervals exclude zero). With 10 boxes per cover, retrain 2 reaches 0.34–0.36 recall on tear, 0.85–0.89 on corner and 0.79–0.81 on spine.
The third checkpoint recovered, and passed the first. At 817 training covers, with corner and spine boxes standardised, corner wear reached 0.629 AP50 fine-tuned and 0.610 fresh, above the 192-cover trial's best (+0.116, interval +0.056 to +0.174) and the best regrown run (+0.085). Spine trained fresh reached 0.437 and creases 0.460. Tear stayed flat. Part of the corner gain is convention: the training boxes now match the benchmark's size by construction.
| Defect type (my boxes) | Production | Best before | 817 covers, fine-tuned / fresh |
|---|---|---|---|
| Corner wear (474) | 0.327 | 0.513 | 0.629 / 0.610 |
| Spine (53) | 0.211 | 0.402 | 0.259 / 0.437 |
| Crease / bend (80) | 0.297 | 0.422 | 0.429 / 0.460 |
| Staple (77) | 0.610 | 0.652 | 0.678 / 0.693 |
| Tear / chip (479) | 0.083 | 0.150 | 0.148 / 0.151 |
| Surface wear (79) | 0.000 | 0.091 | 0.075 / 0.051 |
| Foxing (42) | 0.000 | 0.008 | 0.058 / 0.019 |
| Stain (47) | 0.000 | 0.030 | 0.084 / 0.061 |
AP50 on the 146 covers. "Best before" is the best earlier run on my labels, or the chain-labelled model for foxing and stain, which had no human-label model yet. Production proposes no surface wear, foxing or stain, hence 0.000. Dropping three low-resolution covers from the benchmark (143 covers) moves no figure by more than 0.003.
Spine by box size. My training spine labels were mostly tiny ticks (404 of 540, 75%), while the blind benchmark is mostly large whole-spine boxes (45 of 53, 85%). The export now joins close ticks into runs, and spine is still reported by box size.
A benchmark score alone promotes nothing. The next section is the test that does.
From benchmark to production
Promotion means passing the whole pipeline
In production every proposal costs a describer call and often a judge call, and a model that proposes more boxes can bury real defects in review. So a candidate has to pass a replay through the production pipeline on the blind covers: the same routing, describer, text verifier and judge, scored against my boxes for defects still found after the judge and for leftover regions that match none of my boxes.
The score floor decides as much as the model. Each type has a floor below which a proposal is dropped, fitted on covers the model never trained on. Fitted to keep 98% of the defects found, the new models sent 86 regions per cover to the describer against production's 36. On a 30-cover replay that let the new crease and staple models find exactly what production found while adding three to five leftover regions per cover. Refitted so that a candidate sends no more regions than production does, the comparison became fair:
| Defect type | My boxes | Found after judge, production → new | Leftover regions per cover | Decision |
|---|---|---|---|---|
| Spine | 53 | 38 → 46 | 5.4 → 1.7 | Promoted |
| Crease / bend | 80 | 55 → 62 | 3.9 → 3.6 | Promoted |
| Corner wear (30 covers) | 102 | 83 → 85 | 0.33 → 0.17 | Promoted |
| Tear / chip | 479 | 296 → 292 | 9.2 → 8.9 | Production stays: no gain |
| Staple | 74 | 70 → 65 | at about production's volume | Production stays |
| Surface wear, foxing, stain (30 covers) | 29 | 0 → 8 | 0 → 2 to 5.5 each | Not promoted: recall at a review cost |
146 covers unless marked. Differences were checked with a paired bootstrap over covers (500 resamples): spine found +0.151 (interval +0.044 to +0.265) and leftovers −3.7 per cover (−4.7 to −2.7); corner leftovers −0.17 (−0.33 to −0.07); crease found +0.087 (0.000 to +0.183), an interval that touches zero, so crease was promoted on a borderline result. Staple is from the 88 validation covers, where its floor was chosen. The full replay cost about $62 in API usage.
Before each switch I checked the effect on severity: the new models' boxes land in the same severity band as my boxes as often or more often (corner 82% → 94%, crease 83% → 86%, spine level at 94–95%). The worker then had to reproduce the scored boxes exactly on 12 covers before it went live.
First live books. On 25 October the new corner, spine and crease models went live, each with its own floor, and the next three books I submitted were graded on them. They cost $0.97, $1.01 and $2.18 in API usage. In my audit of the first, a heavily worn Amazing Spider-Man #61, 41 of the 62 defects that went into the grade were the right type (some boxes adjusted), 9 were real damage of another type and 12 I rejected. It also showed something to watch: I shrank three of its four corner boxes to well under half their area. Three books are not a verdict, but they are the first evidence from photos no model had seen.
Decision log
Selected experiments
| Question | Result | Decision |
|---|---|---|
| Which VLM should describe regions? | On an owner-labelled book: 27 found / 3 false / 4 missed for the chosen model vs 4 / 5 / 27 for the previous one | Switched describer |
| Can batching regions per call cut cost? | 5× fewer calls, but recall fell from 27 to 17 | Rejected; one region per call |
| Which judge, fast or slightly more accurate? | The slower model's 90th-percentile call took 107 s; the faster one finished a cover front in 4.2 min instead of 31 | Faster judge on the critical path |
| Two judge candidates on 105 sealed packets | One: 97% recall, 16% specificity. Other: 83% recall, 48% specificity | A true tradeoff; neither promoted, both advanced to a fresh test |
| Does a local image model help as a damage check? | DINOv3 and a fine-tuned 2B VLM scored 0.90–0.91 AUROC on 308 regions I had reviewed, but only 0.79–0.81 on the 146 blind-labelled covers, below the detector's own score (0.93) | Not used as filters; a detector-score floor does the job better |
| One detector or one per defect type? | On blind labels both score about 0.26 mAP50; per-type models find far more appearance damage and fewer tears | Choose per type |
| Does the judge still earn its call? | Its rejects were real 46% of the time vs 40% for its confirms. Its useful "wrong type" verdict matched the describer naming a different type (14% real vs 42% when the types agree) | Replace with a type-agreement rule in code, pending a shadow test on owner-labelled books |
| Do human labels beat model-chain labels? | 192 audited covers beat ~3,700 chain-labelled covers: tear AP 0.108 → 0.155, corner AP 0.32 → 0.49–0.51 (bootstrap intervals exclude zero; chance AP 0.21 on corner); spine inconclusive | Keep auditing; retrain per type as each type reaches its label target |
| Does box size matter for corner wear? | Corner labels tightened to about half the benchmark's area: AP50 0.29–0.39. The same boxes regrown to benchmark size in code: 0.45–0.54 | One box-size standard per type, applied at export as a recorded derived step |
| Do the ~900-cover models survive the whole pipeline? | At production's region volume: spine found 46 vs 38 of 53 with a third of the leftover regions; crease 62 vs 55 of 80; corner 85 vs 83 of 102 with half the leftovers; tear level; staple worse | Promoted corner, spine and crease on 25 October; tear and staple stay on production |
| Can tiling recover small defects? | Tear recall 65% → 80% with a 2×2 grid on full-resolution photos | Adopt for tear |
| Does the grade engine work with perfect inputs? | An August check fed human-verified defects to the engine of the time. The engine has changed since, and the figures on record don't yet line up with the current five-view workflow. The current audit is reconciling them. | Being re-validated; no accuracy figure until that finishes |
Production
Running it
Serving
- React PWA → FastAPI backend with asynchronous grading jobs and polling
- GPU worker in Docker runs geometry and RF-DETR
- VLM calls through an API gateway, with the model chosen per stage in configuration
- Postgres for grading results, defects and review decisions
Operational lessons
- Detector checkpoints are tied to the library version. A newer version silently changed the output head shape, so versions are pinned and every checkpoint is recorded with its hash.
- Every long job is resumable, and a crash exits non-zero so the container restarts.
- Every label decision now goes to an append-only, hash-chained ledger: human, model or legacy provenance on each entry, synced from the labelling tool every 15 minutes and verified nightly against a backup copy. Edits and deletions are blocked at the database level.
- An independent review found that two syncs running at once could fork that chain permanently. I reproduced it (two concurrent syncs wrote 20,000 duplicate events), serialized the writers, and redeployed after a verified backup. Three nightly backups in October also failed unnoticed: the job ran as the laptop woke, before the network was up. It now waits for the server before starting.
- A deploy that passed every container check still failed its first real job: new code used Redis commands the worker's least-privilege account did not allow. The jobs stopped before any paid call and were retried, a test now checks the permissions against the code, and a deploy counts as proven only after a real grading job.
Cost. A September test book cost $12.61 on the most accurate VLM path, too much to be the only option, and I planned two quality tiers. I kept the accurate path and cut the number of regions instead: per-type score floors and merging same-type near-duplicates. The first three books on the new detectors made 187 to 446 model calls each, against 2,317 for the September book, and cost $0.97 to $2.18. Cost still grows with damage; the most worn book cost the most. Shortening prompts or turning off model reasoning risked missing defects, so I left them alone.
Known limits
Where it is weak
- Appearance damage (stain, foxing, surface wear, fading, water) is still the hardest, both to box and to judge. The new models find some of it, but not yet at a review cost worth paying.
- Tears are the type I add most often by hand, and the retrained tear model is only level with production.
- Colour fading and detached covers have very few confirmed examples.
- Glare, shadows, the table at cover edges and art that depicts wear cause false positives.
- Photos of slabbed books add case scuffs and glare along the edges.
- Grades are decision support with evidence attached, not an authoritative grade.
How I work
Using AI coding tools
I build with AI coding assistants, and much of the implementation code is written with them. I set the direction, design the experiments and decision rules, label the evaluation data, read the failures and make the calls: which bottleneck to attack, when to stop an approach, what counts as ground truth. The investigations above are that part of the work.